Tempo and the OTel Collector, the trace pipeline
June 2, 2026
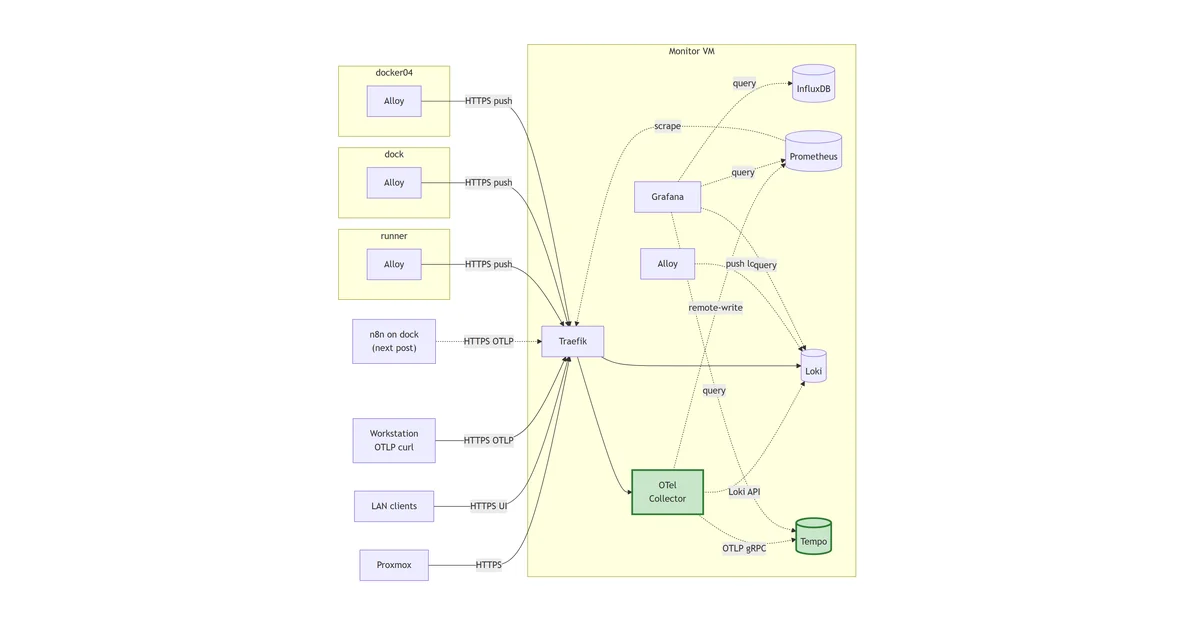
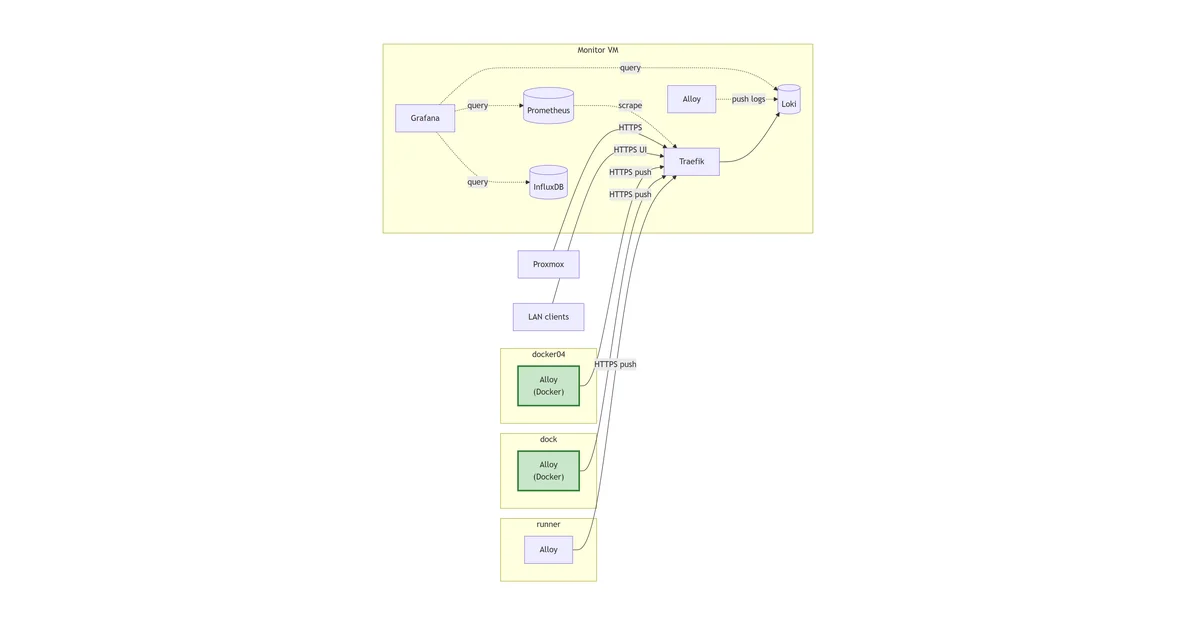
The lab can see two of the three signal types. Prometheus scrapes /metrics endpoints on a 15s cadence and stores time-series. Alloy follows every container’s stdout via the Docker daemon API and pushes log lines to Loki. Both are working across three Docker hosts plus the non-Docker runner. What’s still missing is the third leg of the observability tripod: anywhere for an instrumented application to push OTLP-format telemetry, and anywhere to put the traces when they arrive.
This post lands both halves of that gap in one go. Tempo becomes the trace store on monitor, fronted by Traefik at tempo.lab.davidmjudge.me.uk. The OpenTelemetry Collector becomes the push ingest plane at otelcol.lab.davidmjudge.me.uk, accepting OTLP HTTP from anywhere on the LAN and fanning out to Prometheus (via remote-write), Loki (via the loki exporter), and Tempo (via OTLP gRPC over the internal Docker network). By the end, a synthetic OTLP push from a workstation goes through Traefik, hits the Collector, splits into three pipelines, and the same signal lands queryable in all three backends.
Why both in one post
The two components are one architectural unit. A trace store with nothing producing traces is a directory of empty files; an ingest plane whose biggest signal type points at nothing is broken by design. Splitting them across two posts means either deploying the store with no smoke test that goes through the production path, or deploying the Collector with a deliberately-broken trace exporter that next post resolves. Both shapes are worse than landing the pair together.
This isn’t a new pattern in the rebuild series. Loki and Alloy did the same thing: log store and first agent stood up in one post, then satellite Alloys rolled out in follow-up posts. Here, the trace pipeline is the post, and the first real producer (n8n instrumentation) is what the next post does.
The stack so far
flowchart LR
    PX["Proxmox"]
    Client["LAN clients"]
    WS["Workstation
OTLP curl"]
    N8N["n8n on dock
(next post)"]
    subgraph runner["runner"]
        RA["Alloy"]
    end
    subgraph dock["dock"]
        DA["Alloy"]
    end
    subgraph docker04["docker04"]
        D4A["Alloy"]
    end
    subgraph monitor["Monitor VM"]
        TR["Traefik"]
        IDB[("InfluxDB")]
        PR[("Prometheus")]
        LK[("Loki")]
        AL["Alloy"]
        TP[("Tempo")]:::new
        OC["OTel
Collector"]:::new
        GF["Grafana"]
    end
    PX -->|HTTPS| TR
    Client -->|HTTPS UI| TR
    WS -->|HTTPS OTLP| TR
    N8N -.->|HTTPS OTLP| TR
    RA -->|HTTPS push| TR
    DA -->|HTTPS push| TR
    D4A -->|HTTPS push| TR
    TR --> OC
    OC -.->|remote-write| PR
    OC -.->|Loki API| LK
    OC -.->|OTLP gRPC| TP
    TR --> LK
    PR -.->|scrape| TR
    AL -.->|push logs| LK
    GF -.->|query| IDB
    GF -.->|query| PR
    GF -.->|query| LK
    GF -.->|query| TP
    classDef new stroke:#2e7d32,stroke-width:3px,fill:#c8e6c9;
Tempo and the OTel Collector close the trace gap. OTLP producers push to the Collector via Traefik; the Collector fans out to all three backends with a consistent service_name label across signals. The dashed arrow from n8n is what the next post wires up.
Architecture, made explicit
Four design calls earn their own paragraphs before the YAML lands. All four shaped the configs in real ways and the alternatives are worth being honest about.
Receive-only Collector, Prometheus keeps scraping
The OTel Collector ships a prometheusreceiver that does pull-based scraping of /metrics endpoints. Collapsing the lab’s whole metrics ingest into the Collector is tempting: one config file, one processor pipeline, one place that decides what gets dropped or relabelled. The rejected alternative.
Three reasons it doesn’t earn its complexity here. Prometheus’s pull model is already humming. The file-SD workflow (drop a JSON file in config/targets/, POST /-/reload, no scrape config edit) is a deliberate design choice that the OTel idiom would re-litigate. And the blast radius is smaller this way: a Collector outage takes app telemetry down but leaves node and Traefik metrics flowing exactly as they did before. The Collector is the new path; the scrape path is the working path.
What the Collector handles is the half Prometheus doesn’t: anything pushed in OTLP format. App-emitted metrics from instrumented services arrive via OTLP HTTP, get fanned to Prometheus via remote-write, and end up queryable in PromQL alongside the scraped metrics. Each tool does what it’s best at.
Head-based sampling at 100%
OTel offers two sampling shapes. Head-based decides at the start of a trace whether to keep it; the decision propagates via traceparent headers, so every downstream service makes the same call. Tail-based buffers all spans for a trace, waits for the trace to finish, then keeps or drops based on the whole picture (errors, latency, service). Tail-based is smarter; head-based is cheaper.
At homelab scale, tail-based is the wrong answer. The trace volume from a handful of services is tiny, the cost pressure that justifies buffering doesn’t apply, and the portfolio story the rebuild series builds towards needs every alerting trace findable in Tempo. Sampling at 10% would be a coin flip on whether the trace for any given alert was actually captured. Head-based at 100% keeps everything; the Collector’s processor pipeline stays simple (batch + resource, no tail_sampling) and the diagram is one less stateful component.
The revisit trigger is straightforward: when Tempo’s disk usage starts hurting, swap to tail-based with a “keep errors + keep slow + sample fast successes” policy. Future post in its own right.
OTLP HTTP via Traefik, gRPC internal-only
n8n runs on dock, not on monitor. So do future instrumented apps as the lab grows. For any of them to push to the Collector, the OTLP receiver has to be reachable from off-host.
The pattern for “internal store needs to accept off-host pushes” is established in the lab. Loki on monitor is Traefik-fronted at loki.lab.davidmjudge.me.uk. Satellite Alloys push to that URL over HTTPS, with TLS terminated at Traefik via the Cloudflare DNS-01 cert resolver and no auth on the LAN. The Collector follows the same shape: otelcol.lab.davidmjudge.me.uk, same trust model, same Bind CNAME → Traefik → container plumbing.
OTLP gRPC stays unexposed. gRPC-through-Traefik needs h2c routing that’s fiddly to set up, and there’s no functional gain at this scale: satellite producers use OTLP HTTP exclusively and lose nothing measurable. The gRPC receiver still listens on the monitoring Docker network for in-monitor producers (the Collector’s own self-telemetry, future co-resident apps), which is what matters for the higher-volume internal hops where binary protocol overhead would add up.
The rejected alternative here is the “agent + gateway” pattern: a small OTel Collector on every Docker host that apps push to via localhost, which then forwards to a central gateway Collector. It’s what OTel themselves recommend at production scale. At homelab scale, it’s another stack to deploy per host for benefits that don’t yet exist. Single central Collector is right for now; revisit when central bandwidth or processing cost becomes load-bearing.
Tempo’s two ports, path-routed onto one hostname
Tempo splits its surfaces. Port :4318 accepts OTLP HTTP pushes. Port :3200 serves the HTTP API: /ready for health, /api/traces/<id> for trace lookup, /api/search for queries. Loki keeps everything on :3100; Tempo’s design has them deliberately separate.
The cleanest single-hostname answer is path-based Traefik routing. /v1/* (the OTLP HTTP path) goes to :4318. Everything else goes to :3200. Two routers in the compose, one CNAME, no port suffixes in producer config and no second hostname proliferating the Bind zone. The alternative of a tempo-push.lab.davidmjudge.me.uk second hostname was rejected on the “one CNAME per service” mental model the rest of the lab follows.
This is the only stack in the rebuild series so far that needs more than one Traefik router per container. The OTLP and API surfaces are different enough that funnelling them through one port would be a worse story than two routers on one host name.
Tempo on monitor
The compose:
Show full compose.yaml
services:
  tempo:
    image: grafana/tempo:2.6.1
    container_name: tempo
    hostname: tempo.lab.davidmjudge.me.uk
    restart: unless-stopped
    user: "10001:10001"
    environment:
      - TZ=Europe/London
    command:
      - "-config.file=/etc/tempo/tempo-config.yaml"
    volumes:
      - ./data/tempo:/var/tempo
      - ./config/tempo-config.yaml:/etc/tempo/tempo-config.yaml:ro
    labels:
      - "traefik.enable=true"
      # OTLP push router: /v1/* to :4318
      - "traefik.http.routers.tempo-otlp.rule=Host(`tempo.lab.davidmjudge.me.uk`) && PathPrefix(`/v1`)"
      - "traefik.http.routers.tempo-otlp.entrypoints=websecure"
      - "traefik.http.routers.tempo-otlp.tls=true"
      - "traefik.http.routers.tempo-otlp.tls.certresolver=cloudflare"
      - "traefik.http.routers.tempo-otlp.middlewares=secure-headers@file"
      - "traefik.http.routers.tempo-otlp.service=tempo-otlp"
      - "traefik.http.services.tempo-otlp.loadbalancer.server.port=4318"
      # API router: everything else to :3200
      - "traefik.http.routers.tempo-api.rule=Host(`tempo.lab.davidmjudge.me.uk`)"
      - "traefik.http.routers.tempo-api.entrypoints=websecure"
      - "traefik.http.routers.tempo-api.tls=true"
      - "traefik.http.routers.tempo-api.tls.certresolver=cloudflare"
      - "traefik.http.routers.tempo-api.middlewares=secure-headers@file"
      - "traefik.http.routers.tempo-api.service=tempo-api"
      - "traefik.http.services.tempo-api.loadbalancer.server.port=3200"
    networks:
      - proxy
      - monitoring

networks:
  proxy:
    external: true
  monitoring:
    external: true
Two routers, same hostname, different PathPrefix matchers. Traefik evaluates the more specific rule first because the longer-matching rule wins by default; no explicit priority needed.
The Tempo config is shorter than Loki’s:
Show full tempo-config.yaml
server:
  http_listen_port: 3200
  grpc_listen_port: 9095
  log_level: info

distributor:
  receivers:
    otlp:
      protocols:
        grpc:
          endpoint: 0.0.0.0:4317
        http:
          endpoint: 0.0.0.0:4318

ingester:
  trace_idle_period: 10s
  max_block_duration: 5m

compactor:
  compaction:
    block_retention: 168h

storage:
  trace:
    backend: local
    wal:
      path: /var/tempo/wal
    local:
      path: /var/tempo/blocks

usage_report:
  reporting_enabled: false
Seven days of retention (168h) against Loki’s thirty. The signal stores don’t have to age out at the same cadence: a trace is many spans with attributes, links, and status for one request, where a log line is one line. Trace lookups concentrate on the recent past (“the alert fired ten minutes ago, what was the slow request doing?”), and 30d of traces costs dramatically more disk than 30d of logs. 7d is the homelab budget; raise it if disk has headroom, lower it if disk starts hurting.
Single-binary mode, filesystem storage. Microservices-mode Tempo (distributor + ingester + querier + compactor split out) and S3-compatible backends are right at a different order of magnitude. Same call as Loki’s single-binary mode: the on-disk block layout is identical to what scaled-out Tempo writes, so when the lab eventually outgrows this, the move is a topology change and not a data migration.
Standing it up follows the established workstation pattern:
# CNAME first. In Bind on `dns`:
#   tempo IN CNAME monitor.lab.davidmjudge.me.uk.

# From the workstation
ssh monitor 'mkdir -p ~/tempo'
rsync -av --exclude='data/' stack/05-tempo/ monitor:~/tempo/
ssh monitor
cd ~/tempo

# Tempo runs as UID 10001 inside the container.
mkdir -p data/tempo
sudo chown -R 10001:10001 data/tempo

docker compose up -d
The verification has three checks. Each one is testing something subtly different:
# 1. Tempo's ingester has stabilised.
curl -s https://tempo.lab.davidmjudge.me.uk/ready
# expects: ready
For the first 15 seconds after boot, /ready returns Ingester not ready: waiting for 15s after being ready, a deliberate stabilisation delay before the ingester accepts itself as live. Same behaviour Loki has. Worth knowing so the first verification curl after docker compose up -d doesn’t look like a problem.
# 2. The OTLP HTTP receiver is wired to the right router.
curl -sS -i -X POST https://tempo.lab.davidmjudge.me.uk/v1/traces \
  -H 'Content-Type: application/json' \
  -d '{"resourceSpans": []}'
# expects: HTTP/2 200, body: {}
An empty resourceSpans array is a structurally valid OTLP traces request with no actual data. Tempo accepts it (200, empty body) which proves three things together: the path-based routing sent /v1/* to the OTLP receiver on :4318, the receiver accepted the OTLP payload, and Tempo’s storage path returned success on a no-op.
# 3. The path-based routing isn't accidentally sending everything to one port.
curl -sS -I https://tempo.lab.davidmjudge.me.uk/v1/traces
# expects: HTTP/2 405 (OTLP receiver rejects HEAD)

curl -sS -I https://tempo.lab.davidmjudge.me.uk/ready
# expects: HTTP/2 200 (HTTP API answered)
Different status codes from the two paths is the proof that Traefik is dispatching to two different container ports. If both returned the same thing, the path-routing rule wouldn’t be matching as intended.
Once those three pass, Tempo is alive. The next step is wiring it into Grafana so the trace UI exists. The Tempo datasource provisioning:
apiVersion: 1

datasources:
  - uid: tempo
    name: Tempo
    type: tempo
    access: proxy
    url: http://tempo:3200
    isDefault: false
    editable: false
url: http://tempo:3200 is the internal hostname over the monitoring Docker network, no Traefik hop, no TLS. The explicit uid: tempo is so the Loki datasource’s derived-field rule can reference it by UID once that wiring lands in the n8n post.
Ship the provisioning and restart Grafana:
rsync -av stack/02-grafana/provisioning/ monitor:~/grafana/provisioning/
ssh monitor 'cd ~/grafana && docker compose restart grafana'
After ~10 seconds, Connections → Data sources in Grafana shows Tempo with a Provisioned badge.
Why the API health check is the wrong test
Grafana’s documented pattern for verifying a provisioned datasource looks like:
curl -u admin:<pw> https://grafana.lab.davidmjudge.me.uk/api/datasources/name/Tempo/health
It returns 404 with handler=notfound in Grafana’s logs. The /api/datasources/name/<name>/health route doesn’t exist in current Grafana. The valid health-check route is keyed by UID:
curl -u admin:<pw> https://grafana.lab.davidmjudge.me.uk/api/datasources/uid/tempo/health
That returns 404 too, but with a different body: {"statusCode":404,"messageId":"plugin.notImplemented","message":"Method not implemented"}. The UID-keyed route exists; the Tempo plugin doesn’t implement a CheckHealth handler in this Grafana version. Neither route is useful.
The verification that actually works has two parts. List the datasource via the registry API:
curl -s -u admin:<pw> https://grafana.lab.davidmjudge.me.uk/api/datasources | \
  jq '.[] | select(.name == "Tempo") | {name, type, uid, url}'
# expects: {"name":"Tempo","type":"tempo","uid":"tempo","url":"http://tempo:3200"}
That proves Grafana parsed the YAML and registered the datasource. Then prove the network path Grafana would use:
ssh monitor 'cd ~/grafana && docker compose exec grafana wget -qO- http://tempo:3200/ready'
# expects: ready
If both pass, Grafana can talk to Tempo. The most realistic verification is the one users actually do anyway: open Explore, pick Tempo, switch to the TraceQL tab, run {}. A “0 series returned” response confirms Grafana can query Tempo and the query path is wired; an error indicates a connection problem. The empty result set is the success signal because we haven’t pushed any spans yet beyond the structurally-empty smoke test.
This trap is also in the stack/04-loki/ README. The broken /health URL has been there since Loki landed and nobody noticed because the UI’s “Provisioned” badge was enough proof at the time. Both READMEs are now corrected to the in-container wget pattern.
The OTel Collector on monitor
The Collector is stateless forwarding by design. No bind mount for state, no .env for per-host knobs, just a config file mounted read-only. The compose:
Show full compose.yaml
services:
  otelcol:
    image: otel/opentelemetry-collector-contrib:0.115.1
    container_name: otelcol
    hostname: otelcol.lab.davidmjudge.me.uk
    restart: unless-stopped
    user: "10001:10001"
    environment:
      - TZ=Europe/London
    command:
      - "--config=/etc/otelcol/otel-collector-config.yaml"
    volumes:
      - ./config/otel-collector-config.yaml:/etc/otelcol/otel-collector-config.yaml:ro
    labels:
      - "traefik.enable=true"
      - "traefik.http.routers.otelcol.rule=Host(`otelcol.lab.davidmjudge.me.uk`)"
      - "traefik.http.routers.otelcol.entrypoints=websecure"
      - "traefik.http.routers.otelcol.tls=true"
      - "traefik.http.routers.otelcol.tls.certresolver=cloudflare"
      - "traefik.http.routers.otelcol.middlewares=secure-headers@file"
      - "traefik.http.services.otelcol.loadbalancer.server.port=4318"
    networks:
      - proxy
      - monitoring

networks:
  proxy:
    external: true
  monitoring:
    external: true
Contrib distribution rather than core: the loki exporter ships only in contrib, as do most third-party-backend exporters this lab will eventually want. The image is bigger, but the config can carry whatever exporter the lab needs without an image swap later.
The Traefik router targets :4318 (OTLP HTTP). The :4317 gRPC port stays unexposed; in-monitor producers reach it as otelcol:4317 over the monitoring Docker network. One CNAME, one router, no path-prefix routing needed because OTLP HTTP carries metrics, logs, and traces all under /v1/* and they’re all destined for the same listener.
The Collector config has four sections: receivers, processors, exporters, service pipelines.
Show full otel-collector-config.yaml
receivers:
  otlp:
    protocols:
      grpc:
        endpoint: 0.0.0.0:4317
      http:
        endpoint: 0.0.0.0:4318

processors:
  batch:
    send_batch_size: 1024
    timeout: 5s

  resource:
    attributes:
      - key: homelab
        value: monitor
        action: upsert

exporters:
  prometheusremotewrite:
    endpoint: http://prometheus:9090/api/v1/write
    resource_to_telemetry_conversion:
      enabled: true

  loki:
    endpoint: http://loki:3100/loki/api/v1/push

  otlp/tempo:
    endpoint: tempo:4317
    tls:
      insecure: true

service:
  pipelines:
    metrics:
      receivers: [otlp]
      processors: [batch, resource]
      exporters: [prometheusremotewrite]
    logs:
      receivers: [otlp]
      processors: [batch, resource]
      exporters: [loki]
    traces:
      receivers: [otlp]
      processors: [batch, resource]
      exporters: [otlp/tempo]
Five details worth calling out beyond the obvious structure.
prometheusremotewrite, not prometheus. The exporter named prometheus serves a /metrics endpoint that Prometheus would scrape, i.e. pull, which is the opposite of what this Collector does. The exporter named prometheusremotewrite pushes to Prometheus’s remote-write endpoint. Names-as-trap worth being explicit about.
resource_to_telemetry_conversion: true. Default behaviour drops resource attributes when remote-writing to Prometheus. The metric value lands but the OTLP labels (service.name, the homelab tag the resource processor added) don’t. Promoting resource attributes to series labels is what makes the same metric queryable per-host, per-service in PromQL. The cost is potential cardinality explosion if a producer adds high-cardinality resource attributes; the answer is for producers not to do that, not to drop labels at the Collector.
loki exporter, not OTLP-HTTP-to-Loki. Loki 3+ accepts OTLP logs natively at /otlp/v1/logs, which means the OTLP HTTP exporter could push there without the loki exporter’s translation step. The loki exporter is also marked for eventual deprecation. Two reasons to stay with it for now: the OTLP-to-Loki-stream translation it does (mapping OTLP resource attributes onto Loki’s labelled-stream model) is exactly the conversion we want, and Loki’s native OTLP endpoint expects structured-metadata config the existing Loki stack doesn’t have. When the deprecation lands as a hard removal, the switch is a single-exporter change plus a Loki-side config update. Not locked in.
Plaintext to backends on the internal network. Three exporters, three plaintext connections over the monitoring Docker network. Same trust model as the existing Alloy-to-Loki push and Grafana-to-Loki/Prometheus queries: the internal network is the trust boundary, TLS terminates at Traefik for traffic crossing the LAN. Adding TLS to internal hops would multiply cert plumbing for no threat-model change.
No file-based queue. The Collector’s in-memory queue retries failed pushes with exponential backoff, but a Collector restart loses the queue. The file_storage extension that adds disk-backed retries is the right answer at scale; not earned at homelab scale where if all three backends are simultaneously down for long enough to overflow a memory queue, the backends are the problem, not buffering.
Prerequisite: Prometheus accepts remote-write
Prometheus’s /api/v1/write endpoint is gated behind a feature flag. The diff to the Prometheus compose is one line in the command array:
- "--web.enable-remote-write-receiver"
Worth knowing: in Prometheus 2.x this was --enable-feature=remote-write-receiver. The feature was promoted from experimental to stable in 3.x and the flag was renamed under the --web. prefix. The old name returns 404 from /api/v1/write with a body that helpfully says remote write receiver needs to be enabled with --web.enable-remote-write-receiver. Prometheus tells you exactly which flag to use, but only if you remember to check the error message rather than the older docs.
docker compose up -d on monitor recreates the container with the new args. (Not restart, which re-runs the existing container with the old command.) The TSDB in the bind mount survives the recreate; the gap costs at most one scrape cycle per target.
After the recreate, curl -i -X POST https://prometheus.lab.davidmjudge.me.uk/api/v1/write should return HTTP/2 400 snappy: corrupt input. That’s the success signal: 400 because the empty body isn’t valid remote-write wire format, with snappy: corrupt input as the parse failure message. The endpoint is alive and trying to decode; properly-encoded snappy-compressed protobuf will be accepted.
Bringing up the Collector
# CNAME first. In Bind on `dns`:
#   otelcol IN CNAME monitor.lab.davidmjudge.me.uk.

ssh monitor 'mkdir -p ~/otelcol'
rsync -av stack/06-otel-collector/ monitor:~/otelcol/
ssh monitor
cd ~/otelcol
docker compose up -d
docker compose logs -f otelcol
The log line to watch for is Everything is ready. Begin running and processing data.. Repeated prometheusremotewrite 404 errors would mean the Prometheus feature flag prerequisite didn’t land; otlp/tempo connect-refused would mean Tempo isn’t reachable on the monitoring network. Neither should appear on a clean deploy.
End-to-end demonstration from a workstation
Three pushes from a workstation prove the trace pipeline is live. Each follows the same shape: a curl to otelcol.lab.davidmjudge.me.uk/v1/<signal> with an OTLP-shaped JSON payload, then a query in the corresponding backend.
Metric
Show metric push payload
NOW_NS=$(date +%s)000000000

curl -sS -X POST https://otelcol.lab.davidmjudge.me.uk/v1/metrics \
  -H 'Content-Type: application/json' \
  -d '{
    "resourceMetrics": [{
      "resource": { "attributes": [
        {"key": "service.name", "value": {"stringValue": "otelcol-smoke"}}
      ]},
      "scopeMetrics": [{
        "metrics": [{
          "name": "otelcol_smoke_total",
          "sum": {
            "isMonotonic": true,
            "aggregationTemporality": 2,
            "dataPoints": [{
              "asInt": "1",
              "timeUnixNano": "'$NOW_NS'"
            }]
          }
        }]
      }]
    }]
  }'
# expects: {"partialSuccess":{}}
Then in Prometheus, otelcol_smoke_total returns:
{
  "metric": {
    "__name__": "otelcol_smoke_total",
    "homelab": "monitor",
    "job": "otelcol-smoke",
    "service_name": "otelcol-smoke"
  },
  "value": [1748880000.123, "1"]
}
Three labels worth flagging. service_name="otelcol-smoke" came from the OTLP service.name resource attribute, promoted to a Prometheus label by resource_to_telemetry_conversion: true. homelab="monitor" came from the Collector’s resource processor (the upsert action that tags every signal passing through). job="otelcol-smoke" is what Prometheus’s remote-write receiver synthesised as the conventional job label from the service.name.
Log
Show log push payload
NOW_NS=$(date +%s)000000000

curl -sS -X POST https://otelcol.lab.davidmjudge.me.uk/v1/logs \
  -H 'Content-Type: application/json' \
  -d '{
    "resourceLogs": [{
      "resource": { "attributes": [
        {"key": "service.name", "value": {"stringValue": "otelcol-log-smoke"}}
      ]},
      "scopeLogs": [{
        "logRecords": [{
          "timeUnixNano": "'$NOW_NS'",
          "severityNumber": 9,
          "severityText": "INFO",
          "body": {"stringValue": "smoke test log line through OTel Collector"}
        }]
      }]
    }]
  }'
In Grafana Explore → Loki:
{service_name="otelcol-log-smoke"}
The log line appears. Same label pattern as the metric: service.name promoted to service_name (with the . → _ substitution Prometheus and Loki both use). The Collector’s loki exporter applies the convention automatically; no explicit label mapping in the config.
Trace
TRACE_ID=5b8efff798038103d269b633813fc60d
SPAN_ID=eee19b7ec3c1b175
NOW_NS=$(date +%s)000000000

curl -sS -X POST https://otelcol.lab.davidmjudge.me.uk/v1/traces \
  -H 'Content-Type: application/json' \
  -d '{
    "resourceSpans": [{
      "resource": { "attributes": [
        {"key": "service.name", "value": {"stringValue": "otelcol-trace-smoke"}}
      ]},
      "scopeSpans": [{
        "spans": [{
          "traceId": "'$TRACE_ID'",
          "spanId": "'$SPAN_ID'",
          "name": "otelcol-pipeline-span",
          "kind": 1,
          "startTimeUnixNano": "'$NOW_NS'",
          "endTimeUnixNano": "'$NOW_NS'"
        }]
      }]
    }]
  }'
In Grafana Explore → Tempo → TraceQL:
{trace:id="5b8efff798038103d269b633813fc60d"}
A single trace returns with one span named otelcol-pipeline-span from service otelcol-trace-smoke. Tempo’s trace_idle_period: 10s means the span sits in the ingester for ten seconds after the push before being flushed; the first query within that window may return no rows, a second query after the wait returns the trace.
The service.name thread that runs through all three signals is the design pivot. Every OTLP producer setting service.name is identifiable across metrics, logs, and traces with the same label name (modulo the _ substitution). When n8n becomes the first real producer in the next post, the same service_name="n8n" query will work across all three Grafana datasources. That’s the foundation the “alert → log → trace → root cause in one Grafana session” capstone story rests on.
What this gets us
One push URL for any future instrumented application, regardless of which Docker host it lands on. Three signal stores wired and addressable with a consistent label vocabulary. A clean separation between push-shaped ingest (this Collector) and pull-shaped ingest (Prometheus continuing to scrape), with neither path crowding the other out.
The architecturally interesting shift is that “what signals is this service producing?” stops being a per-store question. Before this post, “is the service producing metrics?” meant a different lookup from “is it producing logs?”. After, the answer to all three is the same service.name filter across the same Grafana session. The cost was one Collector and one trace store, both single-binary and both fronted by the Traefik that already exists.
Where we are
Three signal pipelines (metrics, logs, traces) flow through the Collector at otelcol.lab.davidmjudge.me.uk, fanned to Prometheus, Loki, and Tempo respectively, with a consistent service_name label across all three. The Tempo store at tempo.lab.davidmjudge.me.uk holds seven days of traces; the Collector is stateless and forwards in real time.
What’s next
n8n instrumentation. The first real producer pushing through this pipeline, with workflow telemetry as the test signal. Once n8n’s traces and logs both carry a trace_id, the Loki datasource’s derived-fields rule gets wired (Loki line containing a trace_id opens its trace in Tempo with one click), and the “alert → log → trace” navigation that the portfolio capstone leans on becomes a real workflow rather than an architectural claim. That post is the payoff for everything from Rebuild-01 onwards.