Rolling Alloy to a non-Docker host
May 28, 2026
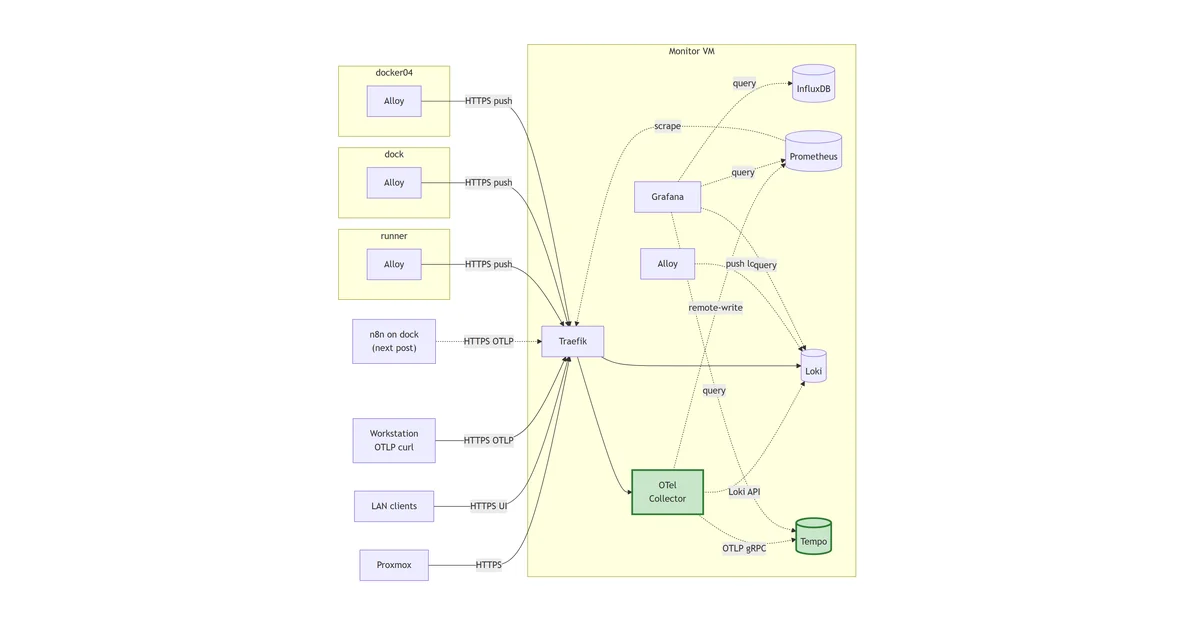
The five stacks deployed so far all live on the monitor VM, and the Alloy from the last post is shipping logs from every container on that one host. There’s a second machine in the lab whose logs I want in the same place: runner, the VM that hosts a set of Python job-scraping scripts under /opt/eMailJobScraper/. The scrapers write per-invocation log files like scraper_20260528_165802.log, and right now the only way to read any of it is ssh runner and tail -f. Same SSH-and-tail dance the central-logging story is meant to end, one host earlier than the planned roll-out.
This post takes a single step sideways from the build sequence to ship those logs into the existing Loki. Slightly out of order on purpose: doing it now is the cheapest end-to-end test that the central pipeline actually accepts pushes from a different box, and a non-Docker workload exercises a different Alloy shape (file tailing, native systemd, no compose) than the multi-host Docker roll-out queued up next.
The stack so far
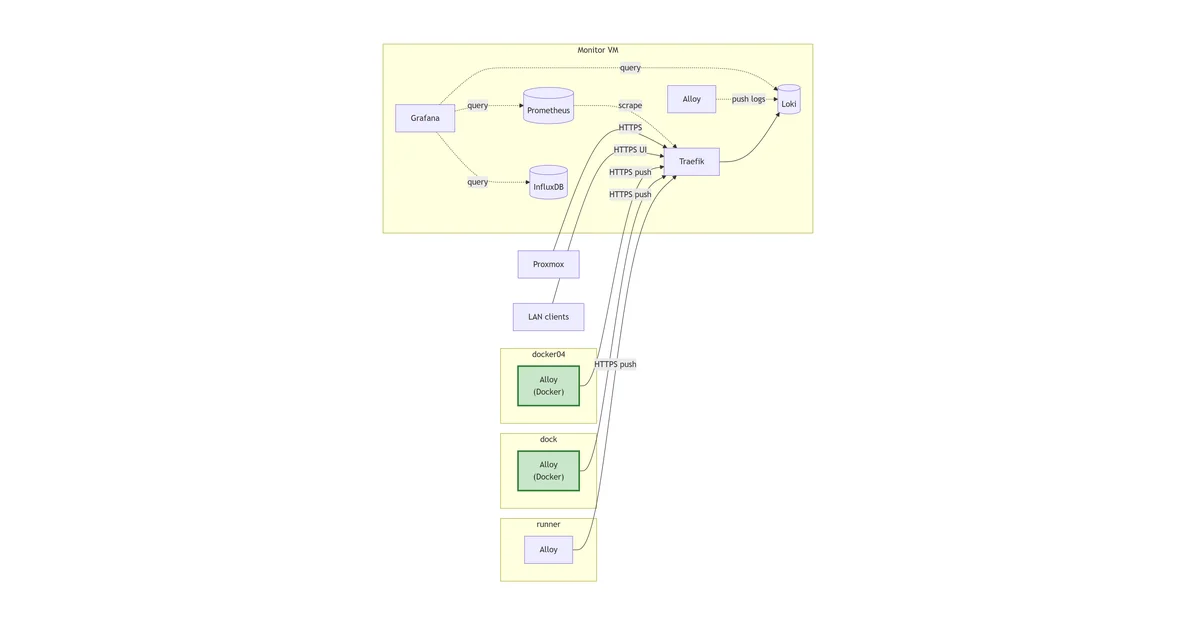
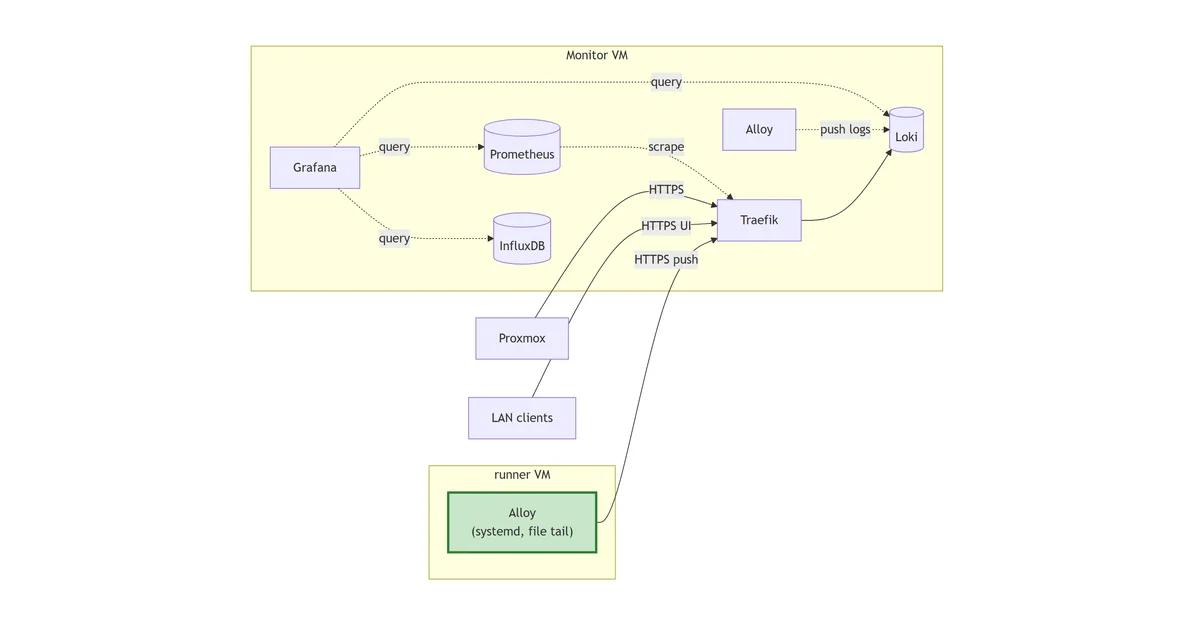
flowchart LR
PX["Proxmox"]
Client["LAN clients"]
subgraph runner["runner VM"]
RA["Alloy
(systemd, file tail)"]:::new
end
subgraph monitor["Monitor VM"]
TR["Traefik"]
IDB[("InfluxDB")]
PR[("Prometheus")]
LK[("Loki")]
AL["Alloy"]
GF["Grafana"]
end
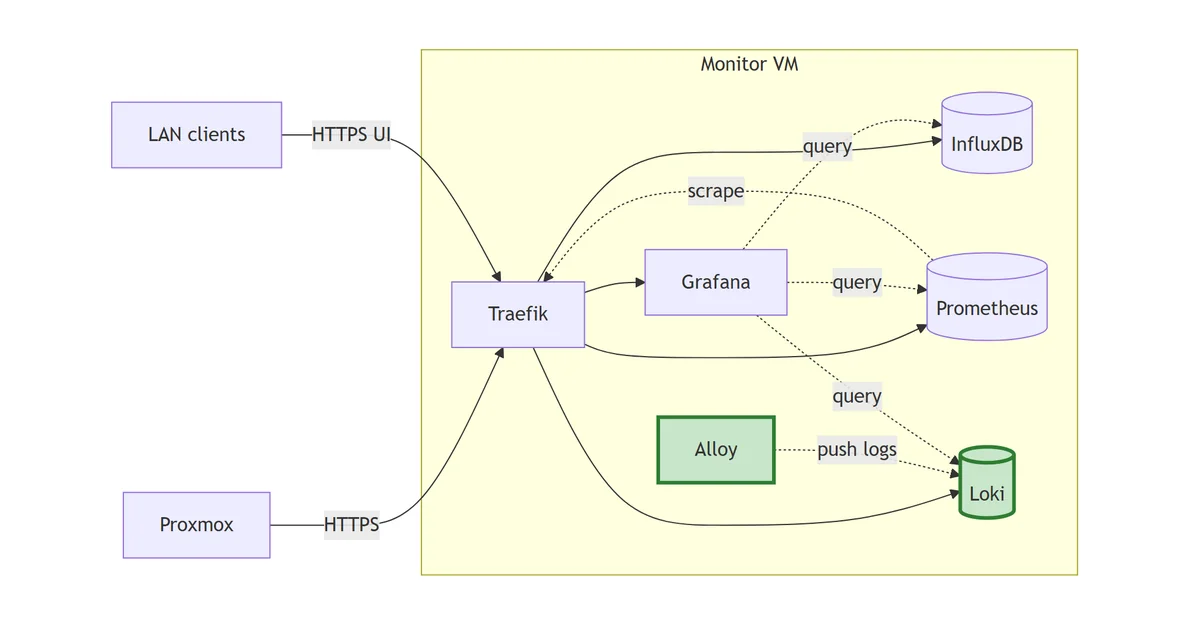
PX -->|HTTPS| TR
Client -->|HTTPS UI| TR
RA -->|HTTPS push| TR
TR --> LK
PR -.->|scrape| TR
AL -.->|push logs| LK
GF -.->|query| IDB
GF -.->|query| PR
GF -.->|query| LK
classDef new stroke:#2e7d32,stroke-width:3px,fill:#c8e6c9;
First off-host log producer. Runner’s Alloy is a native systemd install (not Docker) tailing Python script logs and pushing through Loki’s public Traefik endpoint.
Why this is out of sequence
The roadmap teased at the end of the Loki/Alloy post had Alloy rolling out to the other Docker hosts in the lab (influx, dns, the Proxmox host itself), all running the same compose file with a one-line label change per host. That’s still the right next step for the Docker-resident workloads, and it’s the one I’ll write up after this. But there are two things doing the non-Docker case first earns that doing it after wouldn’t:
It’s a smoke test for the central architecture. Until something outside the monitor VM successfully pushes to https://loki.lab.davidmjudge.me.uk/loki/api/v1/push, the public push endpoint is theoretical. The Traefik router exists, the cert is valid, the in-stack Alloy talks to Loki over the in-stack monitoring network and never touches the public URL. Anyone who’s stood up enough of these will tell you the public endpoint is exactly the kind of thing that looks fine until the first external client tries to use it and finds out the certificate chain isn’t trusted by the client’s resolver, or the firewall rule was scoped wrong, or the push body limit is too low. Better to find that out from one well-understood agent now than to discover it during a roll-out to four hosts at once.
It introduces the file-source pattern. Every other Alloy in this homelab so far has used loki.source.docker, which only works when the producer is a Docker container observed via the daemon’s API. Plenty of useful workloads run as systemd units, cron jobs, or scripts dropped under /opt, and Alloy reads those through loki.source.file instead. That’s a different first hop in the pipeline (file globs and inotify rather than the Docker daemon HTTP API), a different ownership model (the agent’s UID needs read access to log files on disk, not membership of the docker group), and a different deployment shape (native systemd rather than a compose service). Worth its own post rather than tucked inside a “roll-out to four hosts” entry where the file-source story would get half a paragraph.
Alloy is the OpenTelemetry Collector with Grafana on top
Worth flagging this here because it’s the load-bearing reason Alloy is the agent in this stack rather than Promtail, Vector, or Fluent Bit, and because it shows up explicitly in two posts’ time.
Alloy is built on the OpenTelemetry Collector’s component model and embeds the upstream otelcol receivers, processors, and exporters directly (Alloy docs, Alloy reference: OTel compatibility). The Grafana-specific components (the loki.*, prometheus.*, and mimir.* families) sit alongside the OTel ones in the same runtime, sharing the same configuration language and the same component graph. That’s a structural rather than aspirational claim: when this stack reaches the OTel-collector and Tempo steps later in the series, the receivers we need (otelcol.receiver.otlp over both HTTP and gRPC) and the exporters we’ll point at Tempo (otelcol.exporter.otlp) are already present in the agent I’m installing today.
The practical consequence is convergence. The Alloy going onto runner right now is tailing files for Loki. The same binary, with one component added per signal, will accept OTLP traces from the eMailJobScraper if I instrument it with the Python OTel SDK (OpenTelemetry overview, Python SDK quickstart) and forward them to Tempo. No second agent on runner, no second supervisor, no second set of credentials to manage. Today this is a design constraint paying off: choosing Alloy over Promtail at step 4 was a bet that the homelab would want traces and metrics from non-Docker hosts later, and the dividend lands without any extra work on runner.
The reverse-direction claim is also true and occasionally useful: if a third-party agent emits OTLP and we want to receive it centrally, the monitor’s Alloy can accept it (otelcol.receiver.otlp reference). That’s not something I’m wiring today; it’s a door the architecture leaves open.
What changes from the monitor’s Alloy
Three diffs from the Alloy already running on monitor. Everything else (the cardinality discipline on labels, the trust posture around no auth on the LAN, the configuration-as-code shape) carries straight across.
A native systemd service from the apt repo. Monitor runs Alloy in a compose service because everything else on monitor is already Docker, so the marginal cost of one more container was zero. Runner is a pure-application VM with no Docker daemon installed and no other containers, which means deploying Alloy as a container would mean installing Docker as a dependency of observability. That inverts the dependency direction: the agent that watches the host shouldn’t drag a runtime onto the host that wasn’t there before. The apt package gives a systemd-managed binary, a config dir at /etc/alloy/, a state dir at /var/lib/alloy/, log integration via journald, and apt-get upgrade for version bumps. Same operational surface every other systemd service on the host already presents.
File tailing via loki.source.file. The scrapers write actual files, and loki.source.docker only works when the producer is a container being observed through the daemon API. Tailing files is the right pattern for anything else. The pipeline shape stays the same (discover, source, relabel, write), only the first component changes: local.file_match turns the glob into a target list, loki.source.file does the tailing with inotify, and the rest of the chain is identical to monitor’s.
Push over the public TLS endpoint. Monitor’s Alloy talks to http://loki:3100 because both containers share the monitoring Docker network. Runner has no such shortcut; it’s a separate VM. The choice was between (a) opening Loki’s port 3100 to the LAN with no TLS, or (b) using the Traefik-fronted endpoint that already exists on monitor. (b) is free: Traefik already terminates TLS via the Cloudflare cert resolver for https://loki.lab.davidmjudge.me.uk, and runner’s resolver already trusts the Let’s Encrypt chain. No extra config on monitor, no extra surface on runner.
Folder layout
Per-host satellite agents live in one folder per VM that pushes to the central Loki:
stack/04-loki/agents/runner/
├── config.alloy       # loki.source.file -> loki.write to public Loki
└── README.md
No compose, no .env, no data/. Alloy is a systemd service installed from Grafana’s apt repo; its state lives under /var/lib/alloy/ on the host (package-managed, off the repo). The numbered build-step layout remains for the build-step axis; rolling Alloy to a new host is a different axis (per-host, not per-step), and keeping satellites under the stack they push to means the data flow is what’s adjacent in the repo, which is what matters when you’re debugging where a log line came from.
The Alloy config
The runner’s Alloy config:
local.file_match "scraper" {
    path_targets = [{
        __path__ = "/opt/eMailJobScraper/logs/scraper_*.log",
        job      = "emailjobscraper",
    }]
}

loki.source.file "scraper" {
    targets    = local.file_match.scraper.targets
    forward_to = [loki.relabel.scraper.receiver]
}

loki.relabel "scraper" {
    forward_to = [loki.write.remote.receiver]
    rule {
        action = "labeldrop"
        regex  = "filename"
    }
}

loki.write "remote" {
    external_labels = { host = "runner" }
    endpoint {
        url = "https://loki.lab.davidmjudge.me.uk/loki/api/v1/push"
    }
}
Four components, same shape as the Docker pipeline on monitor.
local.file_match turns the glob into a list of targets. The non-__-prefixed keys on each target (here, job) become Loki labels on every line read from those paths. The discoverer rescans on a 10s default interval, so each new scraper_YYYYMMDD_HHMMSS.log written by a fresh scraper run gets picked up automatically without an Alloy reload. New file detection lags by up to ten seconds; once a file is open, new lines flow through inotify in sub-second time.
loki.source.file does the actual tailing. It opens each target, follows it with inotify, and emits one log entry per line. Its read position per file is persisted under /var/lib/alloy/ so a restart doesn’t re-ingest everything.
loki.relabel is the cardinality decision, and it’s the most important block in the file. loki.source.file automatically attaches a filename label to each entry that names the file the line came from. For a workload that rotates by date (one file per scraper run, several per day, hundreds per month), keeping that label indexed would mint a new Loki series per invocation. Loki’s index cost is paid per unique label combination, not per line, and a series count that scales with run-count instead of host-count is the textbook cardinality death the Loki/Alloy post warned about. Dropping it via action = "labeldrop" keeps the indexed label set to exactly {host, job}, which is what the queries actually need. The filename itself is recoverable from inside each log line if anyone ever asks (the scrapers print the run identifier at startup), or could be promoted to structured metadata in a follow-up edit; neither of those pays the indexed cost.
loki.write points at the public endpoint. external_labels = { host = "runner" } attaches the host label to every line out of this agent, which is the one per-host change that gets made when this config rolls to a second satellite. No auth on this endpoint today, same trust call the monitor stack made for the LAN; if/when the trust boundary widens, the upgrade is a basicAuth middleware on Traefik plus a basic_auth { } block inside this endpoint, both one-time edits.
Bringing it up
From the workstation, push the per-host config to runner:
ssh runner 'mkdir -p ~/alloy'
rsync -av stack/04-loki/agents/runner/ runner:~/alloy/
ssh runner
cd ~/alloy
On runner, add Grafana’s apt repo and install Alloy. Grafana sign their packages with a single GPG key for the whole apt repo, so this is the same install pattern that would also bring in Grafana itself, Mimir, or Tempo if any of them needed to land on this host later:
sudo mkdir -p /etc/apt/keyrings
wget -q -O - https://apt.grafana.com/gpg.key | \
    sudo gpg --dearmor -o /etc/apt/keyrings/grafana.gpg
echo "deb [signed-by=/etc/apt/keyrings/grafana.gpg] https://apt.grafana.com stable main" | \
    sudo tee /etc/apt/sources.list.d/grafana.list
sudo apt-get update
sudo apt-get install -y alloy
The package creates an alloy user, drops a systemd unit at /usr/lib/systemd/system/alloy.service, and writes a stub config to /etc/alloy/config.alloy. The unit runs /usr/bin/alloy run --storage.path=/var/lib/alloy/data /etc/alloy/config.alloy as the alloy user, so the first real piece of work is making sure that user can actually read the scraper logs.
This is where I tripped, and the trip is worth a section of its own.
The directory traversal trap
The scraper logs are mode 664 (-rw-rw-r--), which is already group+world readable. The log directory was 700:
$ ls -ln /opt/eMailJobScraper/logs/ | head -3
-rw-rw-r-- 1 1000 1000 155992 May 21 13:00 scraper_20260520_131303.log
-rw-rw-r-- 1 1000 1000  14304 May 21 13:00 scraper_20260520_143102.log
-rw-rw-r-- 1 1000 1000  67344 May 21 13:00 scraper_20260520_150634.log
$ stat -c '%U %G %a' /opt/eMailJobScraper/logs/
david david 700
The instinct (and what I documented in the first cut of this stack’s README) was a single sudo chmod o+rx /opt/eMailJobScraper/logs. The directory is the gate; open the gate, alloy can read the files. Deployed, Alloy started, systemctl status reported active (running) with no errors in the journal, and lsof -p $(pgrep alloy) showed no scraper files open. Twenty seconds later, still nothing. Component graph green, no permission errors, no logs flowing.
The miss was the parent directory. /opt/eMailJobScraper/ itself was also 700, and a process needs o+x (the traverse bit) on every directory segment on the path to a file, not just the immediate parent. With /opt/eMailJobScraper at 700, the alloy user couldn’t enter the directory at all, so the chmod on the leaf was invisible: Alloy couldn’t even reach the inner directory to discover that it had read access on the files inside.
The failure mode is the cruel part. There’s no journal line, no warning, no error in the component graph. local.file_match runs its glob via the standard library, the standard library returns an empty list because traversal failed silently, and Alloy goes about its business with zero targets to tail. From the outside it looks like everything’s working; the agent is just convinced there’s nothing to follow.
The fix is two chmods and one verification:
sudo chmod o+x  /opt/eMailJobScraper
sudo chmod o+rx /opt/eMailJobScraper/logs

# Read a real file as the alloy user. If this succeeds, the whole path
# is traversable; if it fails, `namei -l` will name the segment that's
# still blocking.
sudo -u alloy cat /opt/eMailJobScraper/logs/scraper_*.log | head -1
That last command is the one that costs five seconds and would have saved the diagnosis loop. Running as the agent’s own user is the only definitive check. Anything david can read (because they own the tree), anything root can read (because root bypasses traversal), neither tells you anything useful about whether the agent can read. The sudo -u alloy cat is what the agent’s first poll does internally; if a human can do it, the agent can.
That’s now the documented step in the runner agent’s README and it’ll be the documented step for every future satellite agent that reads files on a non-Docker host. Easier to write the verification line than to debug the silence.
Deploying the config and starting the service
With the perms confirmed:
sudo cp config.alloy /etc/alloy/config.alloy
sudo systemctl enable --now alloy
sudo systemctl restart alloy
sudo systemctl status alloy --no-pager
The enable --now symlinks the unit into multi-user.target and starts the service in one call; the restart after it is belt-and-braces in case the package already auto-started Alloy with the stub config before the new one was in place.
The status output should report active (running) and the recent journal entries should mention component evaluation succeeding for local.file_match.scraper, loki.source.file.scraper, loki.relabel.scraper, and loki.write.remote.
Verification
Three layers, in increasing definitiveness.
Alloy has the files open. lsof against the running process is the unambiguous answer:
sudo lsof -p "$(pgrep -x alloy)" | grep scraper
One line per scraper_*.log file, mode r (reading). If this is empty, the discoverer found nothing; fall back to the traversal check above.
The positions file is moving. Alloy persists the byte offset per tailed file. Two snapshots a few seconds apart with the live scraper running show the offset increasing for the current file:
sudo find /var/lib/alloy -name 'positions.yml' -exec cat {} \;
Lines from this run actually landed in Loki. Most definitive of all. On runner, grab a distinctive substring from a currently-running scraper:
sudo tail -n 3 /opt/eMailJobScraper/logs/scraper_*.log | tail -1
Then in Grafana, Explore -> Loki -> Code, run:
{host="runner"} |= "<substring from above>"
The line should return within ~1-3 seconds of being written: sub-second from inotify, up to ~1s from loki.write’s default 1s batch wait, a few hundred ms through the ingester. (Brand-new files lag up to ~10s through the 10s local.file_match rescan; once a file is open, subsequent lines are sub-second.)
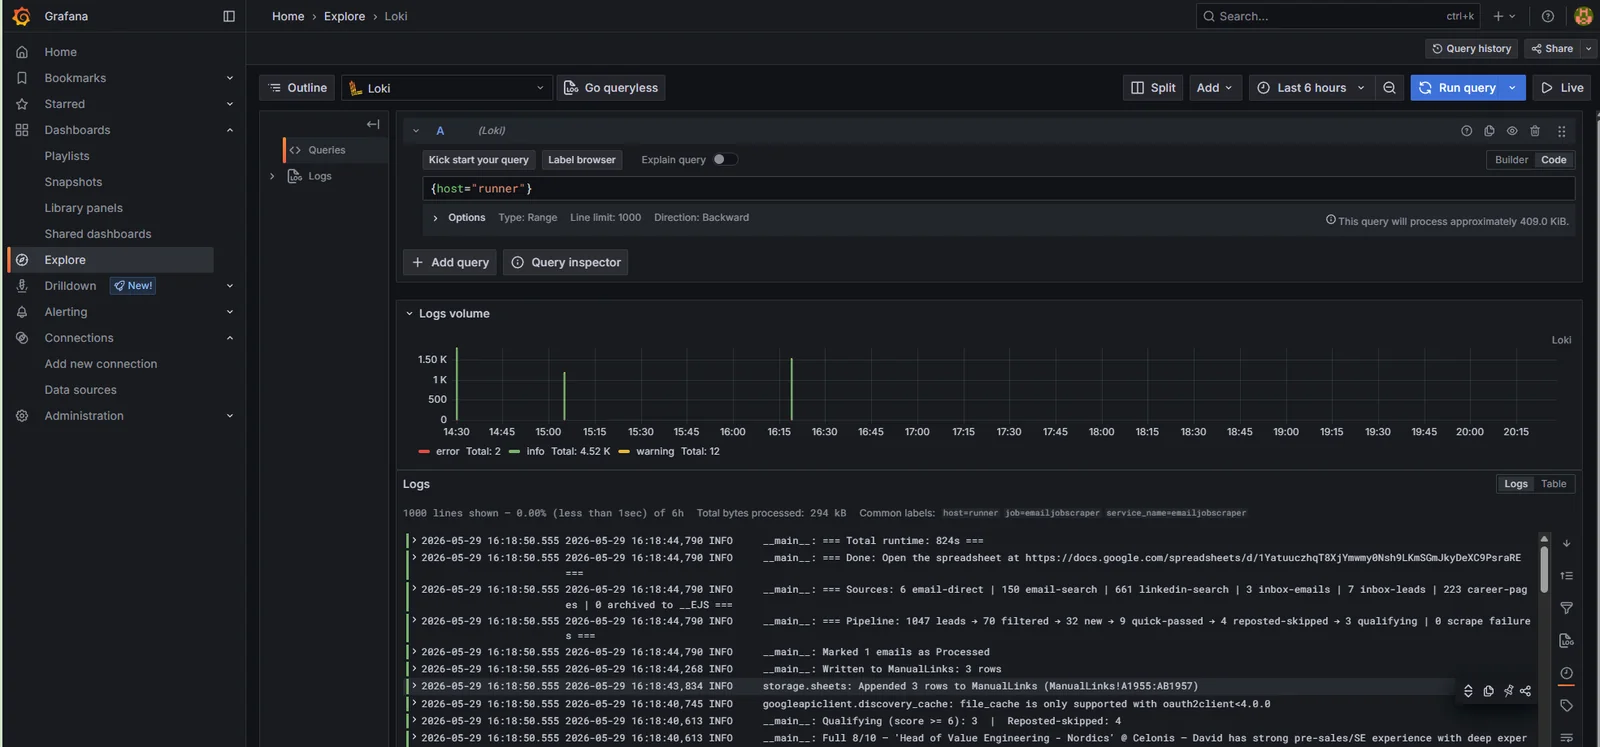
Grafana’s Explore view doesn’t auto-refresh; toggle Live at the top right to stream new lines as they land, otherwise re-run the query manually.
What I deliberately didn’t ship
Multiline stitching for Python tracebacks. A traceback spans many lines and would ideally arrive in Loki as a single entry per traceback rather than one entry per line. Alloy supports this with loki.process and a stage.multiline block, but the regex depends on the exact prefix shape of the scraper’s log lines, and guessing it before seeing real tracebacks in Grafana tends to produce a regex that mis-splits real traces. V1 ships one-line-per-entry; the multiline stage gets added in a follow-up edit once a real traceback is visible in Explore and the prefix is unambiguous.
Auth on the push endpoint. Same call the monitor stack made: runner is on the LAN, runner pushes to a LAN-only DNS name that resolves to a LAN-only IP, the trust posture is no worse than the monitor’s own in-stack call to http://loki:3100. When the trust boundary widens (a VPS shipping logs in, a contractor on the LAN), the upgrade is a basicAuth middleware on Traefik plus a basic_auth { } block inside loki.write.remote, both one-time edits. Doing the basicAuth dance today buys nothing the trust model doesn’t already give for free.
A filename label promoted to structured metadata. Loki 3 supports per-line structured metadata that’s not indexed but is queryable as a field. There’s a case for surfacing the source filename that way so individual scraper runs can be filtered without paying the indexed-cardinality cost. Holding that until a real query actually wants it; speculative metadata is the same cost as a speculative label, just paid in storage rather than index.
Where we are
Six steps in, plus a satellite: the same five from last post running on the monitor VM, with a native-systemd Alloy on runner pushing the eMailJobScraper logs into the central Loki over the Traefik-fronted public endpoint.
What’s next
Back on the planned arc: Alloy rolls to the other Docker hosts in the lab (dock and docker04), running the same compose as monitor’s with the one-line host label change per host. By the end of that post, {host=~".+"} in Grafana returns logs from every running container across the Docker estate, the log-volume chart splits traffic by host, and “ssh to whichever box might have it” stops being part of how I read logs.