InfluxDB for Proxmox metrics
May 23, 2026
InfluxDB is step one for two reasons. First, Proxmox writes metrics natively to InfluxDB with no glue or exporter required. There is no easier way to get every hypervisor metric flowing into something Grafana can query. Second, treating Proxmox as the canonical push-based source sets a useful precedent: not everything in the final stack will be Prometheus-scraped, and the architecture reflects that from the start.
This post stands up InfluxDB v2 on the monitor VM, behind Traefik, then walks through wiring Proxmox up as the first source.
The stack so far
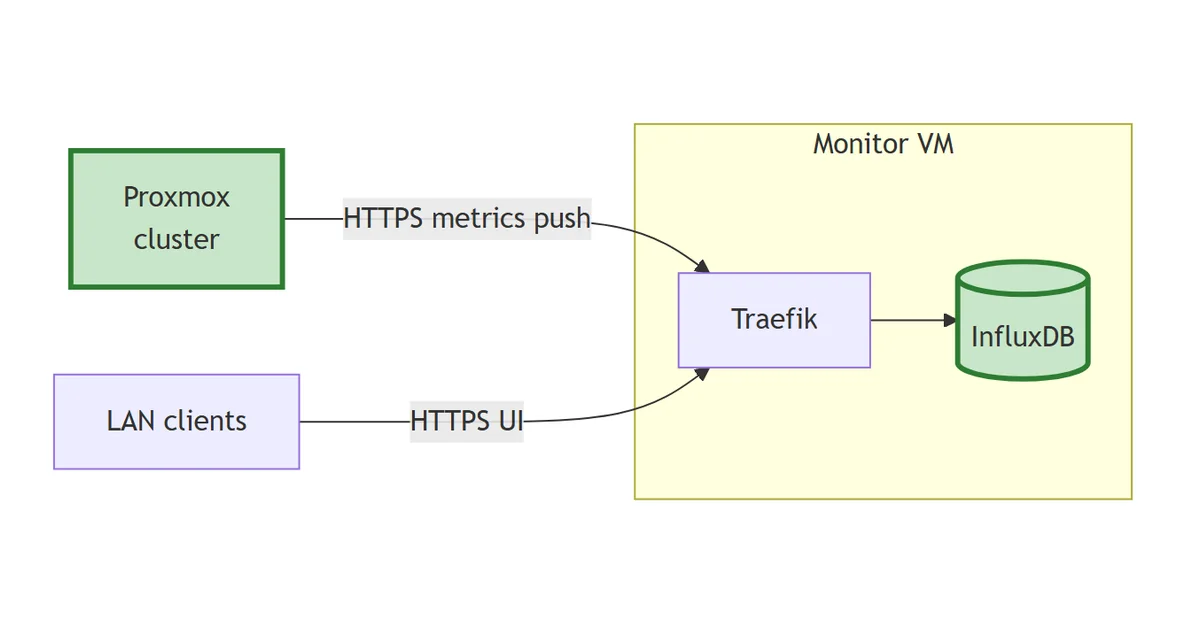
flowchart LR
    PX["Proxmox
cluster"]:::new
    Client["LAN clients"]
    subgraph monitor["Monitor VM"]
        TR["Traefik"]
        IDB[("InfluxDB")]:::new
    end
    PX -->|HTTPS metrics push| TR
    Client -->|HTTPS UI| TR
    TR --> IDB
    classDef new stroke:#2e7d32,stroke-width:3px,fill:#c8e6c9;
First time-series store. Proxmox pushes hypervisor metrics through Traefik to InfluxDB; the UI is reachable at influxdb.lab.davidmjudge.me.uk.
Why v2, not v3
InfluxDB 3 has been out for around a year, but the Docker images and Grafana plugin support are still less mature than the v2 line. v2 ships with Flux and InfluxQL, has a stable HTTP API that the Grafana datasource configuration covers cleanly, and Proxmox’s metric server supports it directly. Stick with v2 until there’s a real reason to move.
Pinned to influxdb:2.7, the last stable in the 2.x line.
The compose
Layout:
stack/01-influxdb/
├── compose.yaml
├── data/                    # gitignored
│   ├── influxdb/            # /var/lib/influxdb2 (time-series data)
│   └── influxdb-config/     # /etc/influxdb2 (runtime config, created on first boot)
├── README.md
└── .env.example
The compose file:
---
services:
  influxdb:
    image: influxdb:2.7
    container_name: influxdb
    hostname: influxdb.lab.davidmjudge.me.uk
    restart: unless-stopped
    environment:
      - TZ=Europe/London
      - DOCKER_INFLUXDB_INIT_MODE=setup
      - DOCKER_INFLUXDB_INIT_USERNAME=${INFLUXDB_ADMIN_USER}
      - DOCKER_INFLUXDB_INIT_PASSWORD=${INFLUXDB_ADMIN_PASSWORD}
      - DOCKER_INFLUXDB_INIT_ORG=${INFLUXDB_ORG}
      - DOCKER_INFLUXDB_INIT_BUCKET=${INFLUXDB_BUCKET_PROXMOX}
      - DOCKER_INFLUXDB_INIT_RETENTION=${INFLUXDB_RETENTION}
      - DOCKER_INFLUXDB_INIT_ADMIN_TOKEN=${INFLUXDB_ADMIN_TOKEN}
    volumes:
      - ./data/influxdb:/var/lib/influxdb2
      - ./data/influxdb-config:/etc/influxdb2
    labels:
      - "traefik.enable=true"
      - "traefik.http.routers.influxdb.rule=Host(`influxdb.lab.davidmjudge.me.uk`)"
      - "traefik.http.routers.influxdb.entrypoints=websecure"
      - "traefik.http.routers.influxdb.tls=true"
      - "traefik.http.routers.influxdb.tls.certresolver=cloudflare"
      - "traefik.http.routers.influxdb.middlewares=secure-headers@file"
      - "traefik.http.services.influxdb.loadbalancer.server.port=8086"
    networks:
      - proxy
      - monitoring

networks:
  proxy:
    external: true
  monitoring:
    external: true
Worth calling out:
DOCKER_INFLUXDB_INIT_*env vars drive InfluxDB’s one-shot bootstrap on first run. They create the admin user, organisation, bucket, retention policy, and admin token. After the first successful start they’re no-ops; the state lives in./data/influxdb-config/.- Pre-set admin token (
DOCKER_INFLUXDB_INIT_ADMIN_TOKEN): a random secret you generate yourself and put in.envbefore the firstdocker compose up -d. InfluxDB reads it during the one-shot bootstrap, creates the admin user with that exact string as the admin’s API token, and then ignores the env var on every subsequent boot (the value lives in./data/influxdb-config/from then on). Setting it up front avoids having to log into the UI to fetch a token before anything else can be configured. It’s still the admin token, so treat it as such.openssl rand -hex 32is the standard way to produce one (64 hex chars, 256 bits of entropy). - No
ports:published. InfluxDB listens on port 8086 inside the container; Traefik routes to it fromhttps://influxdb.lab.davidmjudge.me.uk. Both the UI and the write API live behind the same hostname. - Both networks.
proxyfor Traefik ingress,monitoringso Grafana can reach InfluxDB over the internal backplane asinfluxdb:8086once it arrives in step 3.
.env
# InfluxDB v2: used only on first run; afterwards state lives in ./data/influxdb-config/
INFLUXDB_ADMIN_USER=admin
INFLUXDB_ADMIN_PASSWORD=
# Generate with: openssl rand -hex 32
INFLUXDB_ADMIN_TOKEN=

# Org and bucket
INFLUXDB_ORG=homelab
INFLUXDB_BUCKET_PROXMOX=proxmox

# Retention for the proxmox bucket. 30d is a starting point; extend later if disk allows.
INFLUXDB_RETENTION=30d
A note on retention. Proxmox sends a healthy chunk of data: host CPU, memory, and disk, plus per-VM stats, every 10 seconds. 30 days is enough to debug recent issues and gives Grafana useful week-over-week comparison. Extending to 90 days is the obvious next step once disk usage tells you what’s affordable.
Bringing it up
CNAME first, so the cert challenge will resolve. On the dns host, in the zone file:
influxdb IN CNAME monitor.lab.davidmjudge.me.uk.
Then from the workstation:
ssh monitor 'mkdir -p ~/influxdb'
rsync -av --exclude='.env' --exclude='data/' stack/01-influxdb/ monitor:~/influxdb/
On monitor:
cd ~/influxdb
cp .env.example .env

# Generate the admin token (any cryptographically random string)
openssl rand -hex 32
# Paste the output into INFLUXDB_ADMIN_TOKEN in .env, then set INFLUXDB_ADMIN_PASSWORD too
$EDITOR .env

# Pre-create the bind-mount directories. If Docker creates them, they'll be
# owned by root and InfluxDB (running as UID 1000 in the container) won't be
# able to write to them on first boot.
mkdir -p data/influxdb data/influxdb-config

docker compose up -d
docker compose logs -f influxdb        # watch for "Listening" and the cert grant
On a standard Ubuntu user account this works out of the box: your shell user is UID 1000, mkdir makes the dirs with that ownership, and the container’s UID 1000 matches. If your user is something else, add sudo chown -R 1000:1000 data/ after the mkdir to match the container’s expectation.
Traefik will issue a Let’s Encrypt cert for influxdb.lab.davidmjudge.me.uk via the Cloudflare DNS challenge automatically. The first request to the URL might take a few seconds while it lands.
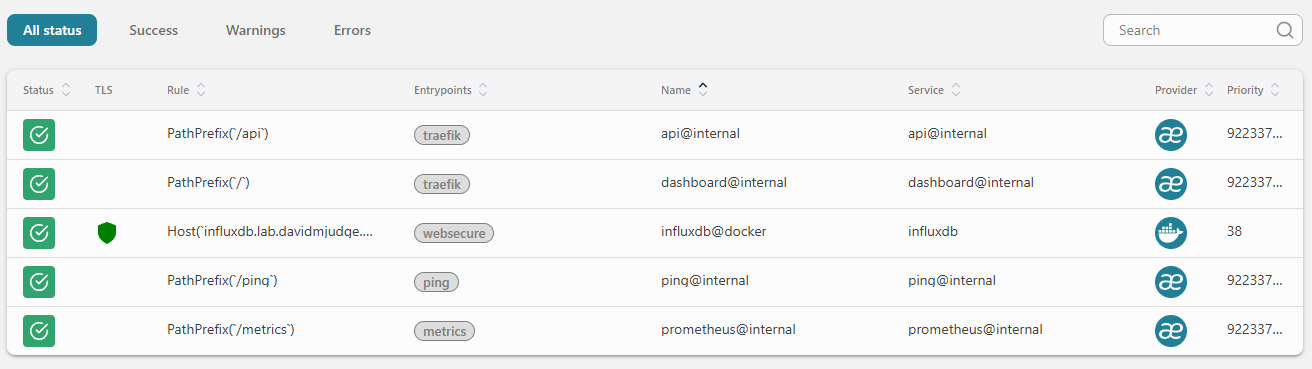
A quick sanity check in the Traefik dashboard at http://traefik-monitor.lab.davidmjudge.me.uk:8080/dashboard/. The new influxdb@docker router should appear green, with TLS active (the shield icon) and bound to the websecure entrypoint:
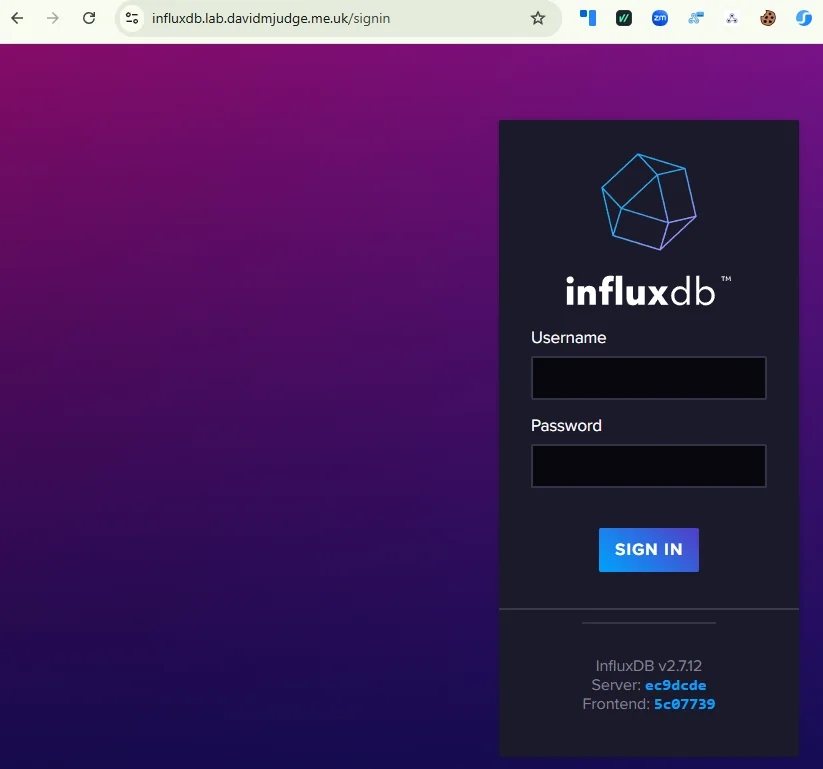
Then open https://influxdb.lab.davidmjudge.me.uk and sign in with the admin user and password from .env. The browser treats the connection as secure with no warnings: the Cloudflare DNS challenge produced a real Let’s Encrypt cert.
A scoped token for Proxmox
Don’t use the admin token to write metrics from Proxmox. If the token leaks, the blast radius is the whole InfluxDB instance. Create a token scoped to write-only on the proxmox bucket.
In the InfluxDB UI:
- Load Data → API Tokens → Generate API Token → Custom API Token
- Description:
proxmox-write - Bucket permissions:
proxmox→ tick Write only (leave Read unticked) - Generate, copy the token immediately. It’s only shown once.
(The token is implicitly scoped to whichever organisation you’re signed into, which is homelab if you used the value from .env. The dialogue doesn’t ask for an org.)
Save it somewhere safe; Proxmox needs it in the next step.
Pointing Proxmox at InfluxDB
In the Proxmox web UI:
- Datacenter → Metric Server → Add → InfluxDB
- Name:
homelab-influxdb(or anything descriptive) - Server:
influxdb.lab.davidmjudge.me.uk - Port:
443 - Protocol:
https - Organization:
homelab - Bucket:
proxmox - Token: the
proxmox-writetoken from the previous step - API path prefix: leave blank (defaults to
/api/v2/write) - Verify Certificate: ticked (we have a real Let’s Encrypt cert via Cloudflare)
- Interval: 10 seconds (Proxmox’s default; fine to leave)
- Enabled: ticked
Save. Proxmox starts pushing immediately.
Verifying
Back in the InfluxDB UI: Data Explorer → select the proxmox bucket. After a minute or two, the measurement list populates with the Proxmox schema:
system: host CPU, load average, uptimecpustat: per-CPU metricsmemory: host memoryblockstat: per-VM disk I/Onics: network interface countersproxmox-support: pveproxy / pvestatd internal metrics
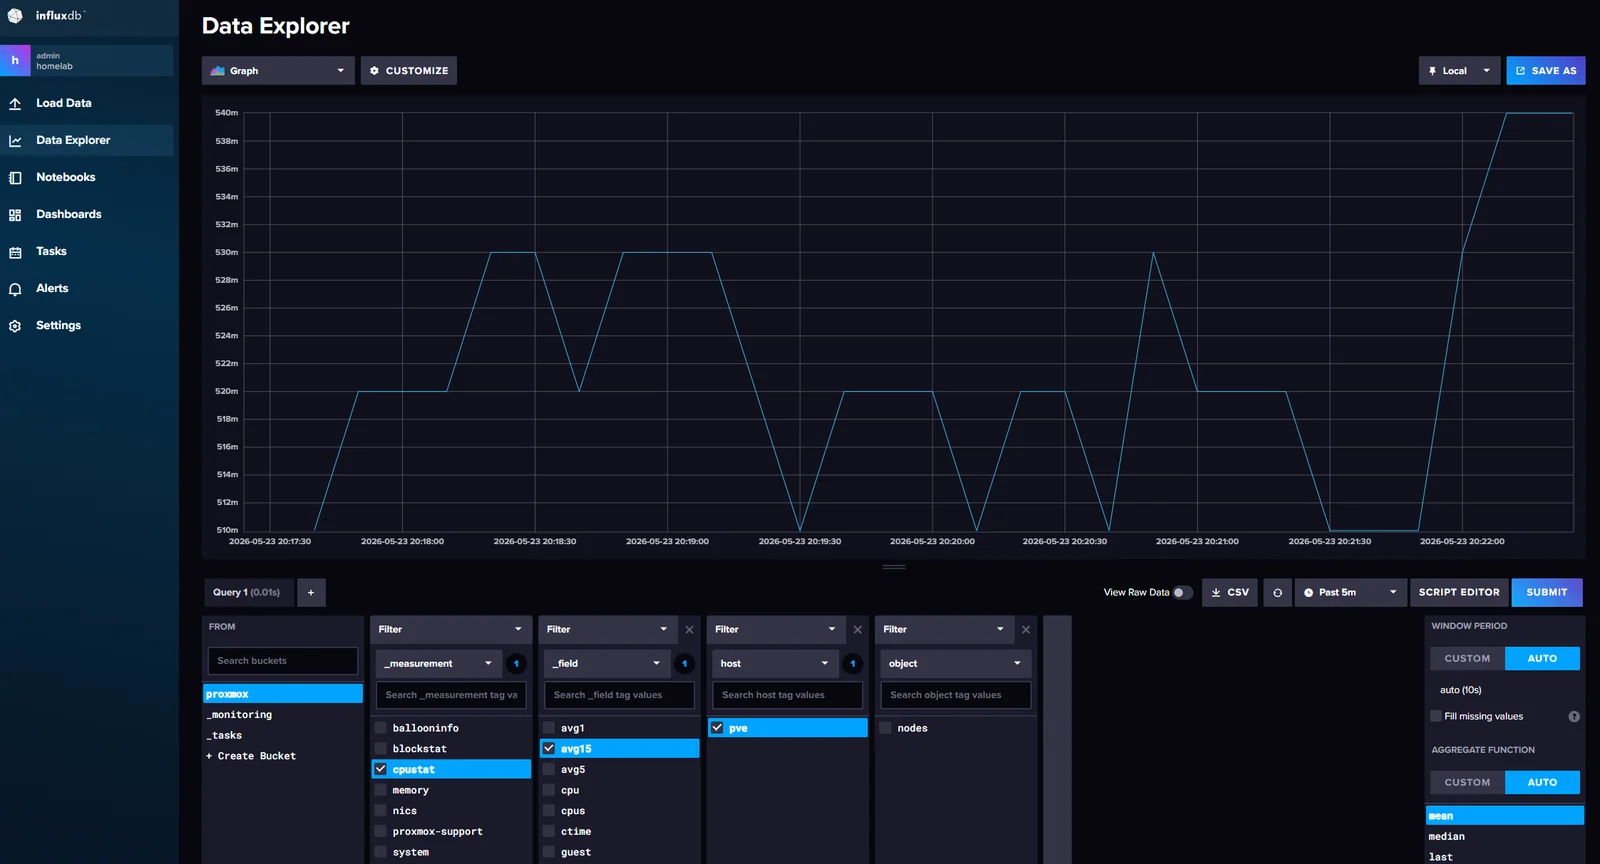
Build a quick query to confirm the flow. Under _measurement tick cpustat, under _field tick avg15 (the 15-minute load average), under host tick your Proxmox node (mine is pve), then Submit. A line on the chart confirms the path end-to-end: Proxmox → Traefik → InfluxDB → query, with a fresh point every 10 seconds.
If nothing arrives, check three things in order:
- The Proxmox web UI for an error against the metric server (red bell icon, top right)
pvestatdlogs on the Proxmox host (journalctl -u pvestatd -f)- Traefik’s access log for the
POST /api/v2/writerequests (docker compose logs traefik -fin~/traefik)
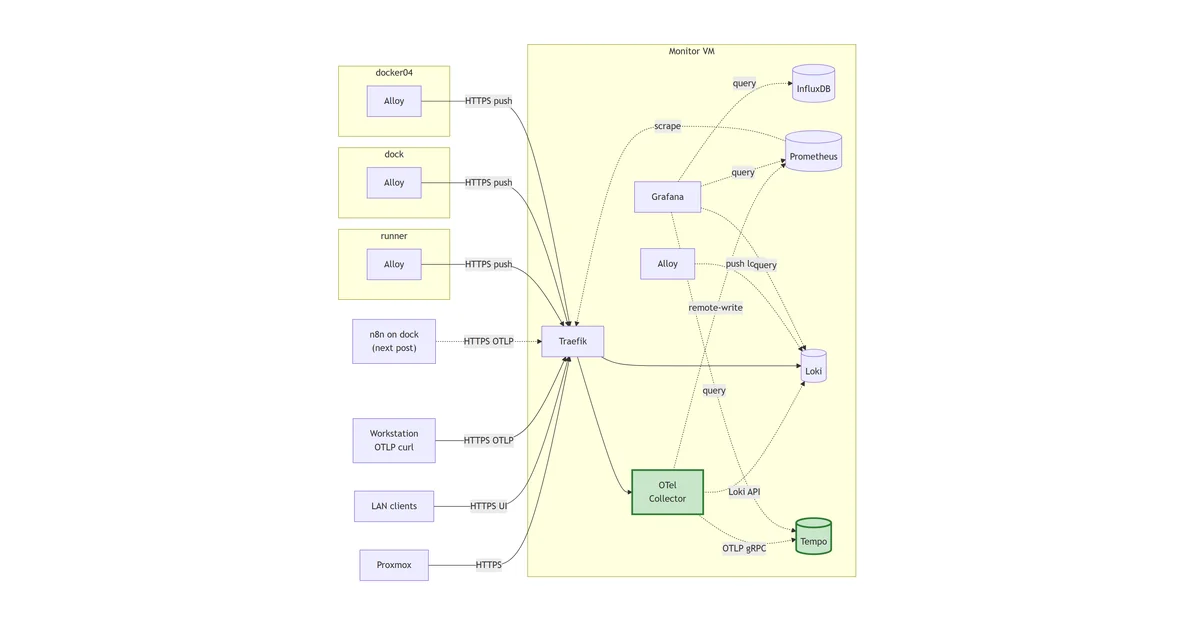
What’s next
Grafana, on top of InfluxDB. Same compose pattern, same networks, same Traefik labels. Once it’s up, the proxmox bucket becomes a Grafana datasource and the first dashboards land.