Setting up the monitor VM and Traefik
May 22, 2026
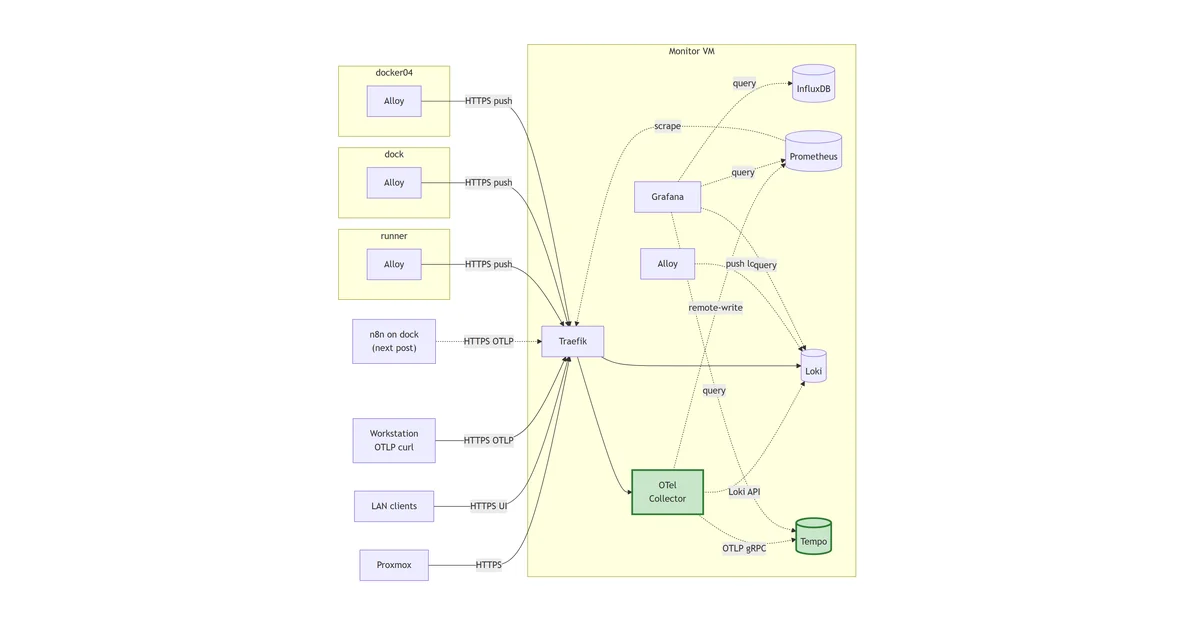
Before any of the observability components arrive, the foundation has to be right. That means a clean VM, a tidy Docker setup, and Traefik already in place as the ingress for everything that follows. Doing this once now means every later post (InfluxDB, Grafana, Prometheus, Loki) can drop straight into the same pattern: container with Traefik labels, CNAME in Bind, HTTPS automatically, no host port published.
I already run Traefik elsewhere in the lab. The docker04 instance terminates traffic for n8n, ntfy, homepage, dockhand, and a handful of other services. The monitor VM gets its own Traefik for the same reason any production team would: keep the blast radius small, and let each host stand alone during upgrades or rebuilds. The configuration here mirrors docker04’s pattern closely, with one or two adaptations.
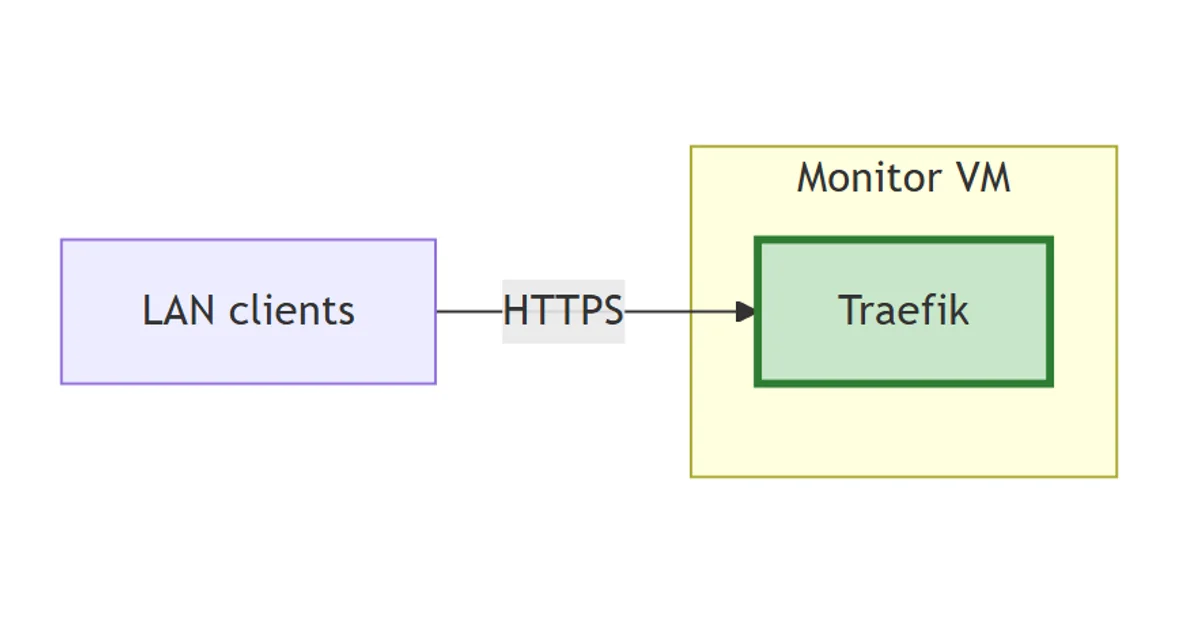
The stack so far
flowchart LR
    Client["LAN clients"]
    subgraph monitor["Monitor VM"]
        TR["Traefik"]:::new
    end
    Client -->|HTTPS| TR
    classDef new stroke:#2e7d32,stroke-width:3px,fill:#c8e6c9;
One VM, one ingress. Every component that lands in the posts that follow will sit behind this HTTPS termination, addressable on a *.lab.davidmjudge.me.uk CNAME.
The VM
A fresh VM on the primary Proxmox host:
- Ubuntu 24.04 LTS
- 4 vCPU, 8 GB RAM, 100 GB disk
- Hostname
monitor, FQDNmonitor.lab.davidmjudge.me.uk - Cloud-init template; SSH key only, no password login
- A record on the Bind zone so
monitor.lab.davidmjudge.me.ukresolves to the new VM
That sizing is deliberately tight. 4 cores and 8 GB sits comfortably for the early steps (Traefik, InfluxDB, Grafana) and leaves headroom for Prometheus and the OpenTelemetry Collector when they arrive. Loki and Tempo are the components most likely to push the spec when the lab gets busy, and bumping memory in Proxmox is a one-minute job, so over-provisioning up front isn’t worth it.
Docker
I install Docker from the official Docker CE apt repository, not the Ubuntu one. The upstream package ships security fixes faster and includes the compose plugin out of the box. After installation, one bit of housekeeping: add the user to the docker group so I’m not reaching for sudo on every compose command.
Then the two external networks the stack will live on:
docker network create proxy
docker network create monitoring
proxyis what Traefik watches. Every container with a UI joins it so Traefik can route to it.monitoringis the shared backplane for the observability stack. Every component joins it, including Traefik (Prometheus needs to scrape Traefik’s metrics endpoint, so it has to be able to reach Traefik). Component-to-component traffic (Grafana querying InfluxDB, OTel Collector writing to Prometheus, and so on) flows here.
UI containers (Grafana, InfluxDB, Prometheus, Alertmanager) join both networks. Backend-only containers (Loki, Tempo, OTel Collector, node_exporter) join only monitoring.
Traefik configuration
The Traefik setup is four files:
stack/00-traefik/
├── compose.yaml
├── config/
│   ├── traefik.yml      # static config
│   └── config.yml       # dynamic config (middlewares)
├── data/
│   └── acme.json        # generated on first run; never committed
└── .env                 # CF_DNS_API_TOKEN
Static config: traefik.yml
Most of the operational behaviour lives here.
global:
  checkNewVersion: false
  sendAnonymousUsage: false

log:
  level: INFO

ping:
  entryPoint: ping

api:
  dashboard: true
  insecure: true

accessLog: {}

metrics:
  prometheus:
    entryPoint: metrics
    addRoutersLabels: true

entryPoints:
  ping:
    address: ":8082"
  metrics:
    address: ":9090"
  web:
    address: ":80"
  websecure:
    address: ":443"

certificatesResolvers:
  cloudflare:
    acme:
      email: david.m.judge@gmail.com
      caServer: https://acme-v02.api.letsencrypt.org/directory
      storage: /var/traefik/certs/acme.json
      dnsChallenge:
        provider: cloudflare
        resolvers:
          - "1.1.1.1:53"
          - "8.8.8.8:53"

providers:
  docker:
    endpoint: "unix:///var/run/docker.sock"
    exposedByDefault: false
    network: proxy
  file:
    filename: /etc/traefik/dynamic/config.yml
    watch: true
Three things worth calling out:
certificatesResolvers.cloudflareuses the DNS-01 challenge against Cloudflare. That’s the right choice for anything under*.lab.davidmjudge.me.ukbecause it works without exposing port 80 to the internet. Traefik writes a TXT record, waits for it to propagate (using 1.1.1.1 and 8.8.8.8 to validate), then collects the cert. Storage isacme.json, bind-mounted from the host so container re-creates don’t blow away the issued certs.providers.docker.exposedByDefault: falseis the safe default. Containers have to opt in by settingtraefik.enable=true. Without it, every container on theproxynetwork would be advertised automatically, which is fine right up until the first time you bring up a half-configured workload and find it’s quietly serving traffic.api.dashboard: trueplusapi.insecure: trueplus the implicit port 8080 entrypoint exposes the Traefik dashboard on:8080over plain HTTP. Same setup docker04 uses today. Reachable from inside the lab. The router doesn’t forward 8080, so nothing outside can hit it. Hardening this further, by putting the dashboard behind Traefik itself with TLS and basic auth, is a fair-enough future improvement. The threat model here doesn’t warrant the extra complexity yet.
Dynamic config: config.yml
One middleware, defined once, available to any router that opts into it:
http:
  middlewares:
    secure-headers:
      headers:
        frameDeny: true
        contentTypeNosniff: true
        browserXssFilter: true
        referrerPolicy: "no-referrer-when-downgrade"
secure-headers applies the basic browser-hardening headers. Routers opt in via the label traefik.http.routers.<name>.middlewares=secure-headers@file. The @file qualifier matters: Traefik discovers the router via the Docker provider but the middleware comes from the file provider, and Traefik 3.x is strict about cross-provider references. Without the qualifier, Traefik looks for secure-headers@docker, can’t find it, and the router falls into an error state (visible as a middleware "secure-headers@docker" does not exist line in the logs and a 404 on the route).
The reason secure-headers lives in the dynamic config rather than alongside the static config is operational: the file provider watches this file and reloads on change without restarting the container, so adding or tweaking middlewares is a hot operation.
Compose: compose.yaml
What actually runs:
---
services:
  traefik:
    image: docker.io/library/traefik:v3.6.4
    container_name: traefik
    security_opt:
      - no-new-privileges:true
    hostname: traefik-monitor.lab.davidmjudge.me.uk
    command:
      - "--configFile=/etc/traefik/traefik.yml"
    ports:
      - "80:80"
      - "443:443"
      - "8080:8080"
      - "9090:9090"
    volumes:
      - /var/run/docker.sock:/var/run/docker.sock:ro
      - ./data/acme.json:/var/traefik/certs/acme.json:rw
      - ./config/traefik.yml:/etc/traefik/traefik.yml:ro
      - ./config/config.yml:/etc/traefik/dynamic/config.yml:ro
    environment:
      - TZ=Europe/London
      - CF_DNS_API_TOKEN=${CF_DNS_API_TOKEN}
    healthcheck:
      test: ["CMD", "wget", "--spider", "-q", "http://127.0.0.1:8082/ping"]
      interval: 30s
      timeout: 5s
      retries: 3
      start_period: 10s
    networks:
      - proxy
      - monitoring
    restart: unless-stopped

networks:
  proxy:
    external: true
  monitoring:
    external: true
A quick note on the volume choice. I prefer bind-mounted folders to named Docker volumes, both here and across the rest of the repo. Backups are easier, and pulling out a specific file (an acme.json to migrate the certs to another host, a single config to inspect) is a plain cp instead of going through docker volume inspect or docker run --rm -v ....
Environment: .env
One variable:
CF_DNS_API_TOKEN=<cloudflare token here>
A Cloudflare API token scoped to the davidmjudge.me.uk zone with Zone:Read plus DNS:Edit permissions. Generated via Cloudflare’s “Custom token” flow, pasted into .env, never committed (the repo’s .gitignore excludes .env everywhere).
DNS for the dashboard
The DNA already has an entry for monitor.lab.davidmjudge.me.uk so all the other entities accessible through traefik will have CNAME entries pointing to monitor....
For traefik-monitor, a CNAME added to the Bind zone on the dns host:
traefik-monitor IN CNAME monitor.lab.davidmjudge.me.uk.
This isn’t strictly required, since the dashboard sits on a port rather than a hostname, but having a name makes it easier to remember when something needs debugging. Equivalents go into Bind for every later service (Grafana, InfluxDB, Prometheus, and so on) as those posts land.
Bringing it up
The configuration files above live in the repo, but Traefik runs on monitor. I prefer copying just the folder over with a clean name (~/traefik/) rather than cloning the whole repo on each host, since the host only needs the files it’s actually running.
From the workstation:
ssh monitor 'mkdir -p ~/traefik'
rsync -av --exclude='.env' --exclude='data/' stack/00-traefik/ monitor:~/traefik/
Then on monitor:
cd ~/traefik
cp .env.example .env
$EDITOR .env       # paste the Cloudflare API token

# acme.json must exist with mode 600 before Traefik starts
mkdir -p data
touch data/acme.json
chmod 600 data/acme.json

docker compose up -d
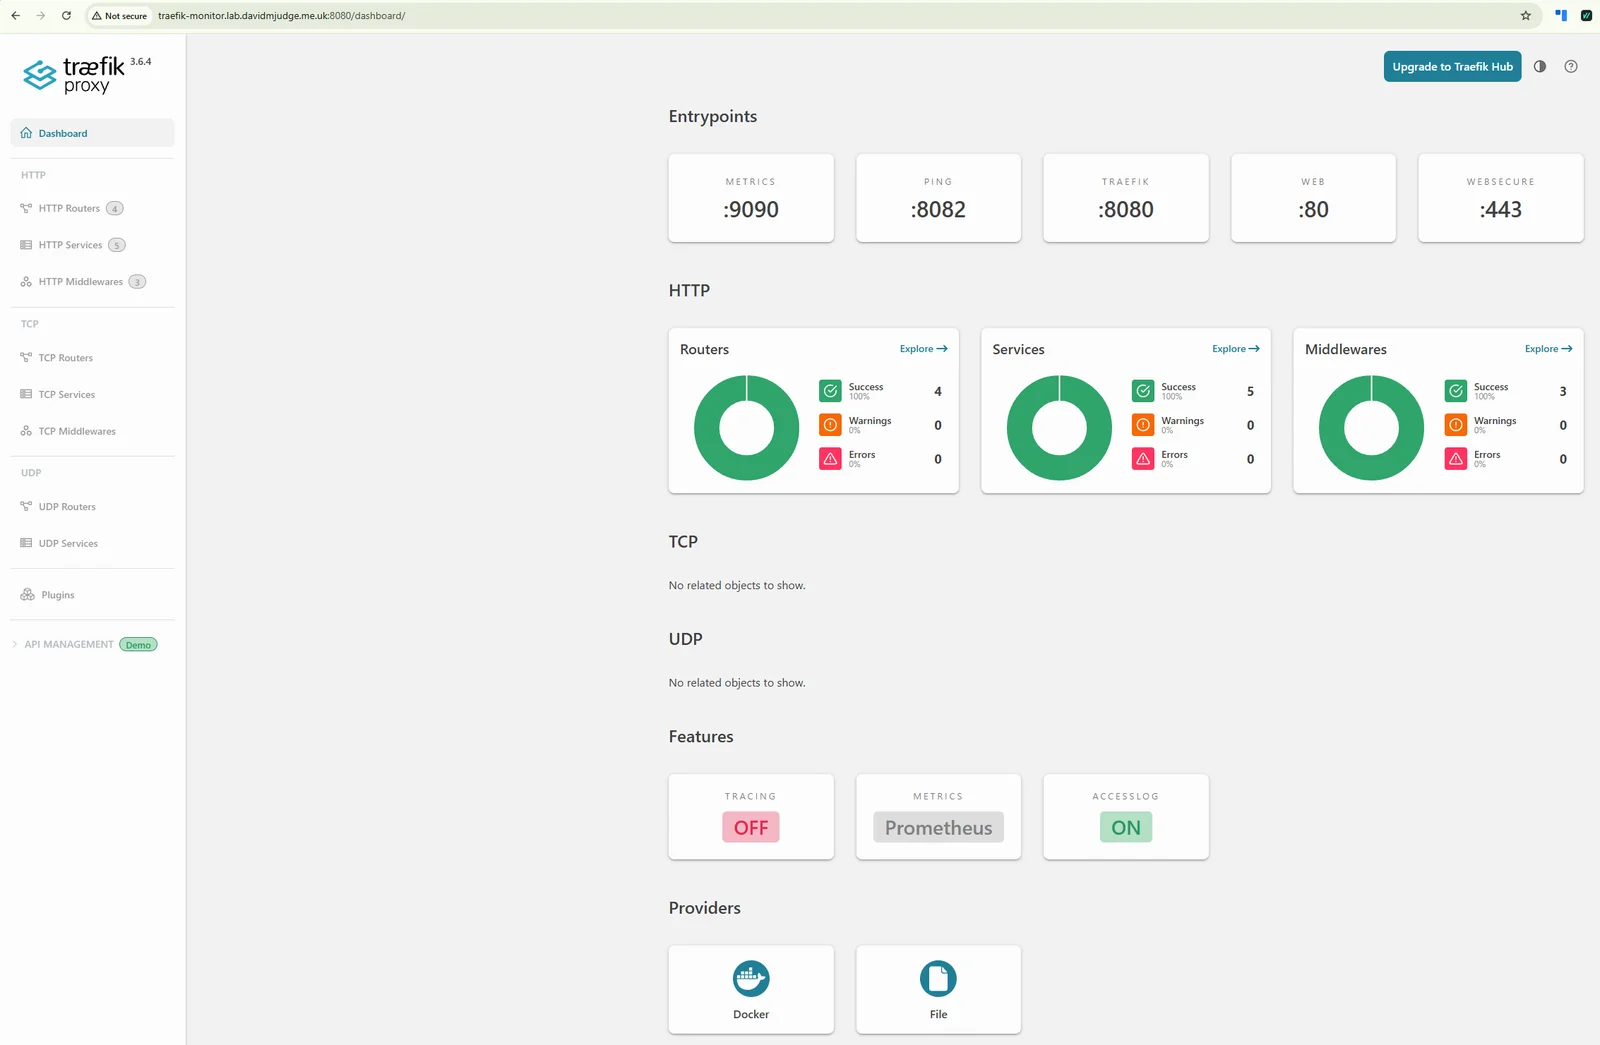
First boot does the certificate dance for any container already labelled. With nothing labelled yet, Traefik just sits there waiting for work. The dashboard at http://traefik-monitor.lab.davidmjudge.me.uk:8080/dashboard/ shows all five entrypoints registered, both Docker and File providers connected, and a handful of Traefik’s own internal routers and services for the dashboard, ping, and metrics endpoints. No user workloads yet.
A quick verification I run after bringing up any fresh Traefik instance:
docker compose logs traefik | grep -i error
docker compose exec traefik wget -qO- http://127.0.0.1:8082/ping
The first should be empty. The second should return OK. Anything else, the logs are the place to start before adding workloads.
What’s next
With the ingress in place, the next post finally gets to monitoring proper: InfluxDB, the bucket where Proxmox’s native metrics exporter will land.